What information is in the portfolio?
The portfolio gathers the assessment results and evaluation feedback generated for you through each phase of the Vista curriculum.
In your portfolio you will find two tabs labeled Discovery and Physician Competency
1. On the Discovery tab you will find your assessment results for all the blocks you have completed including the OASIS evaluation form your faculty have completed for you:
![]()
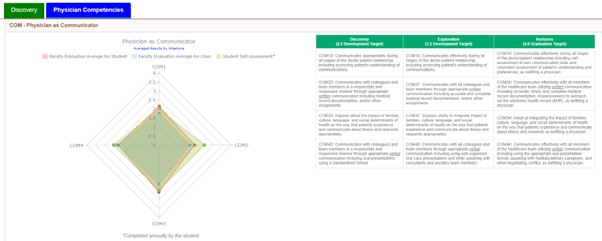
2. The Physician Competencies tab contains all your milestone-based evaluation results from OASIS evaluation forms such as the Workplace Based Assessments (WBAs) in the Discovery phase ECL and CSGF and analyzed into bar and radar graphs showing your averaged results by milestone.
New information and graphs will be added to the Physician Competencies tab as the school enhances features within the portfolio.
Bar Graph shows your averaged milestone results for all milestones (if you do not have results for every milestone yet, don’t worry, the milestones will fill in as you continue to complete Discovery).

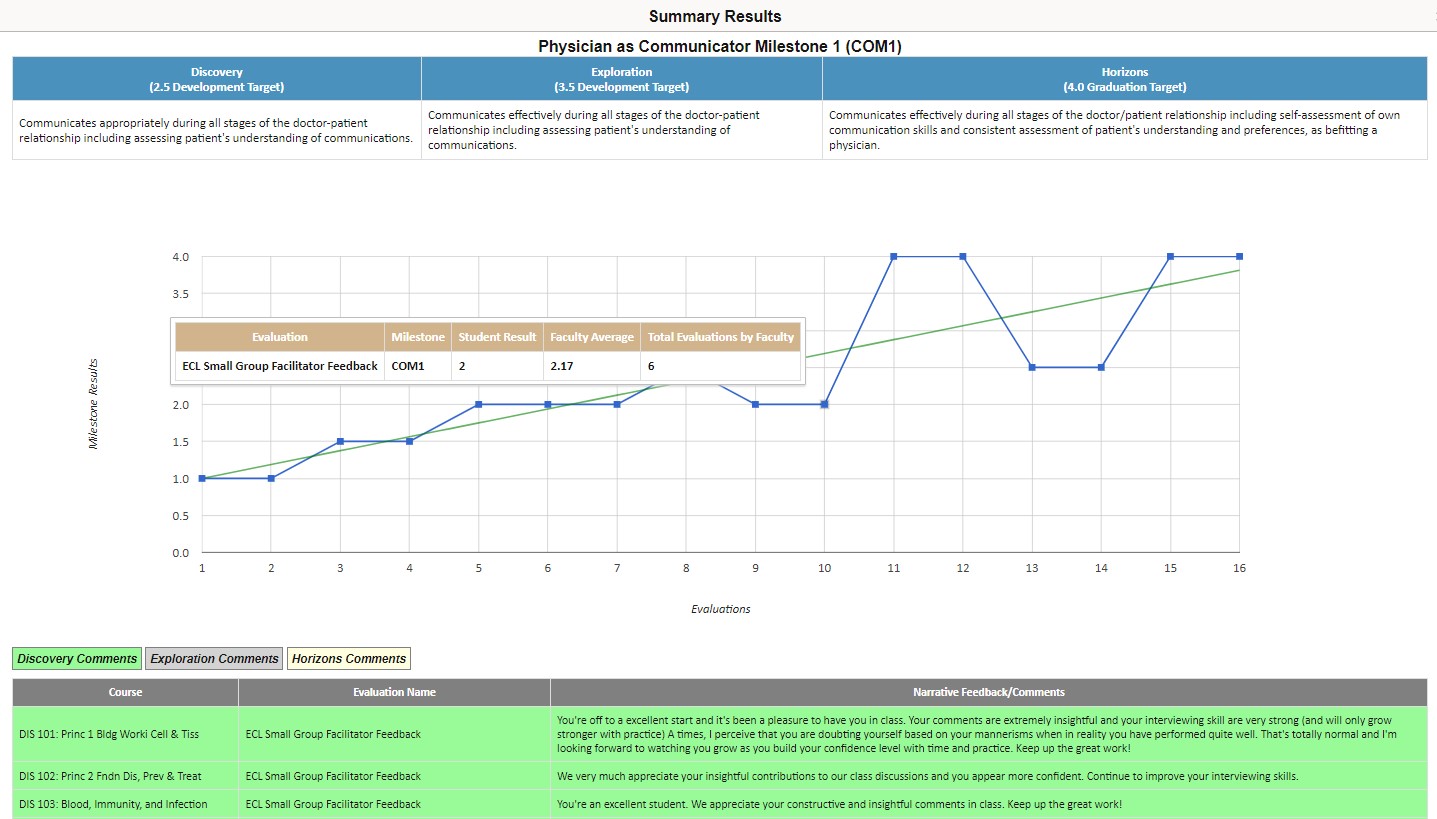
If you click on any bar graph column, you will see a linear graph for that milestone.
Linear graph shows your chronological result progression for that milestone and contains your faculty’s narrative feedback on your evaluations at the bottom also in chronological order. Hover your cursor over any data point on the graph for deeper insight into your results.

Radar Graph shows your averaged milestone results compared to the average for your class and your self-assessment by each Competency and milestone (milestone descriptions provided on the right side of screen; self-assessment data is taken from the annual End of Year Self-Assessment survey you submit)
