With the transition from Google Analytics to Siteimprove, editors now have a suite of content available to them to better analyze what is happening with their website and what they could do to improve it. This blog post will go over how to access and use the Siteimprove platform.
Logging In
- To log into Siteimprove, visit this link: https://my2.siteimprove.com/Auth/Saml2/63427?v=2

- You will be logged in via Single Sign-On (SSO) using your UMass Chan or UMass Memorial credentials
- Once logged in, you will be taken to the initial dashboard view
Groups: choose your site
Groups are used to display information for specific sections of the website. For UMass Chan, this will be how we differentiate between the different microsites that you have access to edit in the CMS.
To select a group, click on the dropdown box next to the website link, and then select the group that you wish to see data for.
- to top of page -
Dashboards
Within Siteimprove, there is a wide selection of dashboards than can be used to visualize key data on your site. To change between the different dashboards available, click on the name of the dashboard itself and a dropdown will appear.
There are three different levels of dashboard:
- System: pre-configured dashboards created by Siteimprove themselves
- Shared: dashboards that have been created by users and are visible to everyone
- Only me: dashboards that you have created and are only visible to you
The system dashboards are as follows:
- DCI Score Dashboard: DCI® Scores across modules (e.g. QA, Accessibility, SEO).
- Digital Marketing Reporting: Provides a comparable overview of key data from SEO, Analytics, and Ads.
- Editor Dashboard (Accessibility): Accessibility metrics of interest to website editors.
- Editor Dashboard (QA): Quality metrics of interest to website editors.
- Management Dashboard: A top-level view of the state of your websites.
Alongside the system dashboards, we have created our own shared dashboards that contain information we felt would be the most helpful for our editors.
- to top of page -
Website Performance Report
This dashboard will serve as a general overview of how your website is performing. If you have received Google Analytics reports from us before, this dashboard will be the most familiar. Most of the information that was in the GA report has been reflected on this dashboard, including:
- Historical comparison of visits, page views, and unique & returning visitors
- Bounce rate, or the number of people who visit your website, and only see the one page
- Traffic sources
- Visitor demographics (country and device used)
- Entry Pages
Accessibility Report
The Accessibility report will give you a view of how your site scores in terms of how accessible your site is and what you can do to improve it. This includes:
- Accessibility score details and progress gauge
- Table of accessibility issues and how to address them
Note: State and local governments must make sure that their web content meets WCAG 2.1, Level AA, requirements by April 24, 2026.
Overview
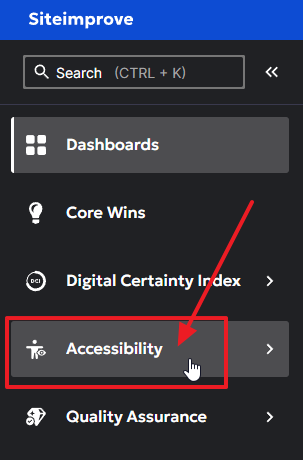
Click on the Assessibility link on the left pane to review the accessiblity issues.
The issues that must be resolved are those marked "A" or "AA". The "S" or "Aria" labeled issues should be fixed, but do not need to be fixed before the 2026 deadline.

From this dashboard, scroll down to review the issues. Click on View all Issues link to see which ones match "A" or "AA."
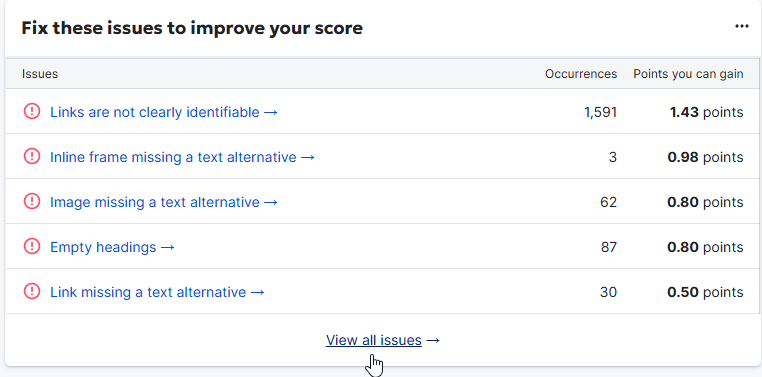
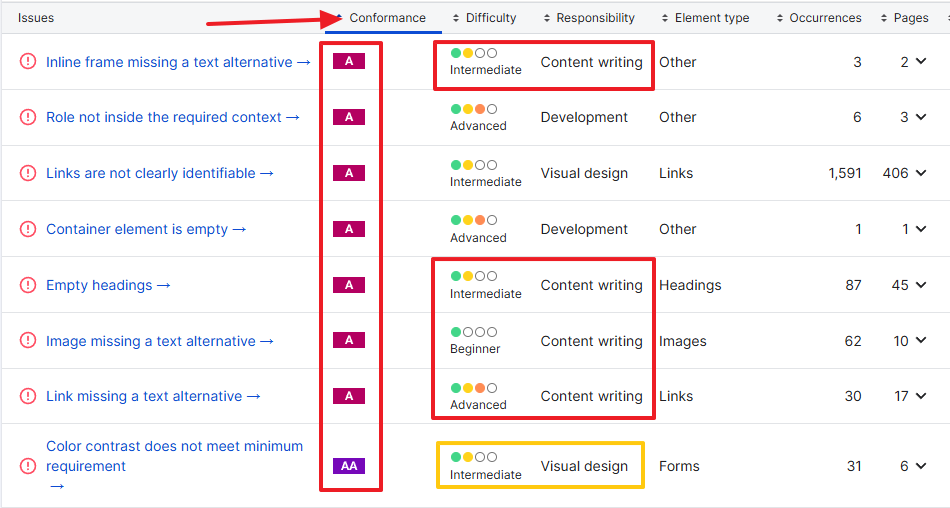
View all issues
Click the Conformance heading to sort so A and AA display first. Under the Responsibility column:
- Content writing would note it's the content editor's job to make this fix.
- Development, IT will handle
- Visual design is mixed.
- Some visual designs elements are within our style sheets and will require IT to make the fix.
- Some visual designs elements are within the WYSIWYG editor and required the content editor to review and fix.
- Unsure who needs to fix the issue or how to fix an issue?
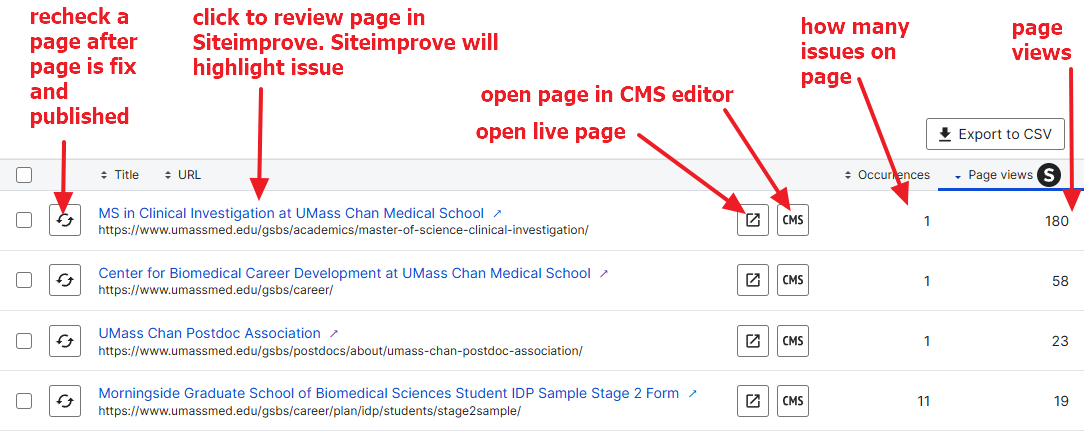
Review a particular issue
Click on an issue to view a list of pages that contain the specific issue. From here, you can:
- Have siteimrpove recheck the page after the issue has been resolved
- Open the page in Siteimprove
- Siteimprove highlights where the issue is on the page
- Open the live page
- Open the page in the CMS to edit the page
- How many issues are on this particular page
- Page views - you may want to tackle the most popular pages first
- Export button - allows you to download to if you wish to track your issues in Excel
Review a page with issues
Click on the link to view in Siteimrpove to review the issue.
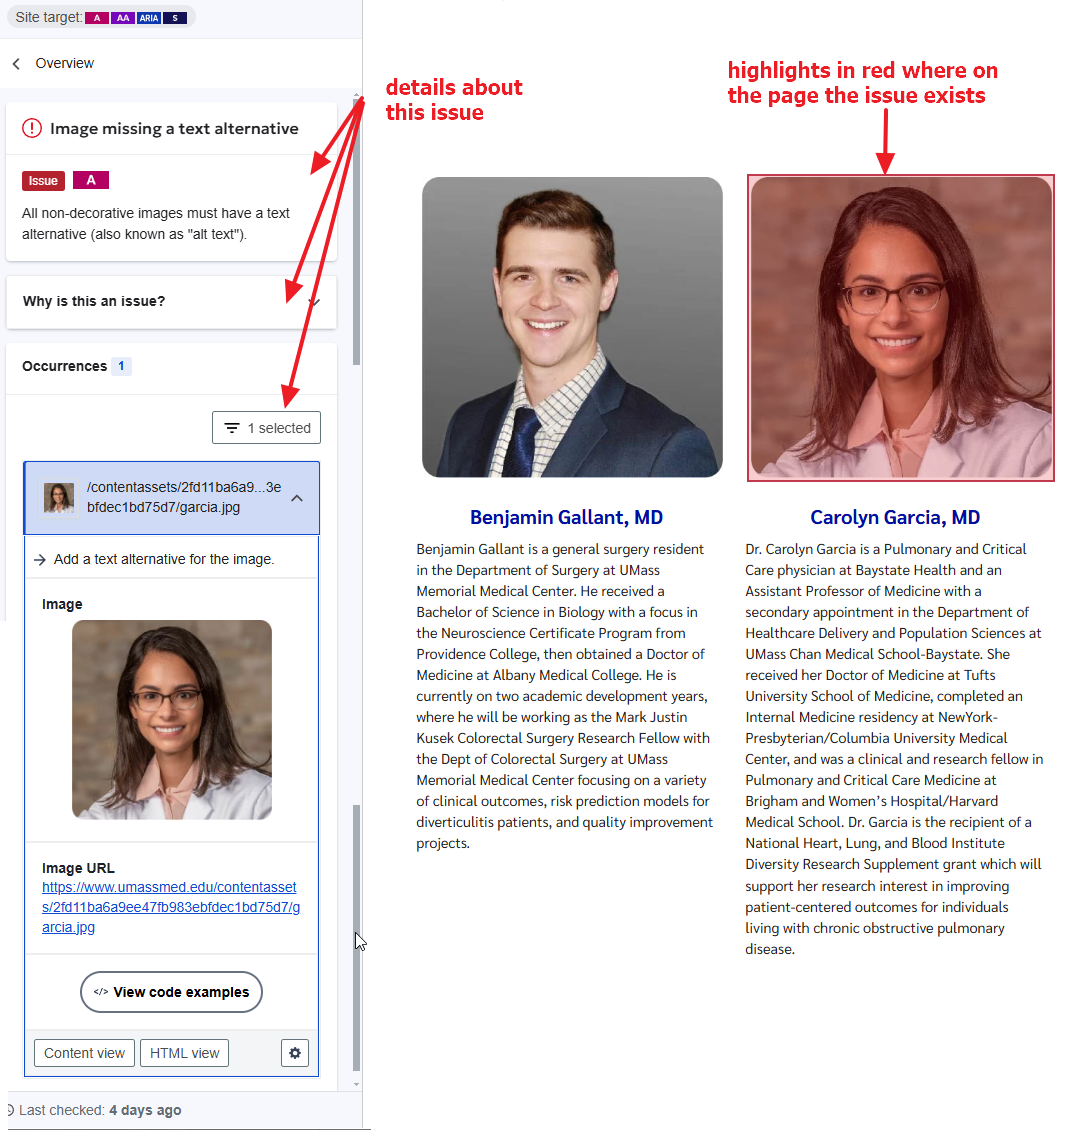
Icon buttons, at the top of this page, allow you to:

- open the live page,
- recheck the page,
- open in the CMS for editing
- open the page inspector for more information about this page (quality assurance, assessibility and SEO)
- to top of page -
Steps to resolve accessibility issues
See: Blog post "Siteimprove: Reolving accessibility issues"
- to top of page -
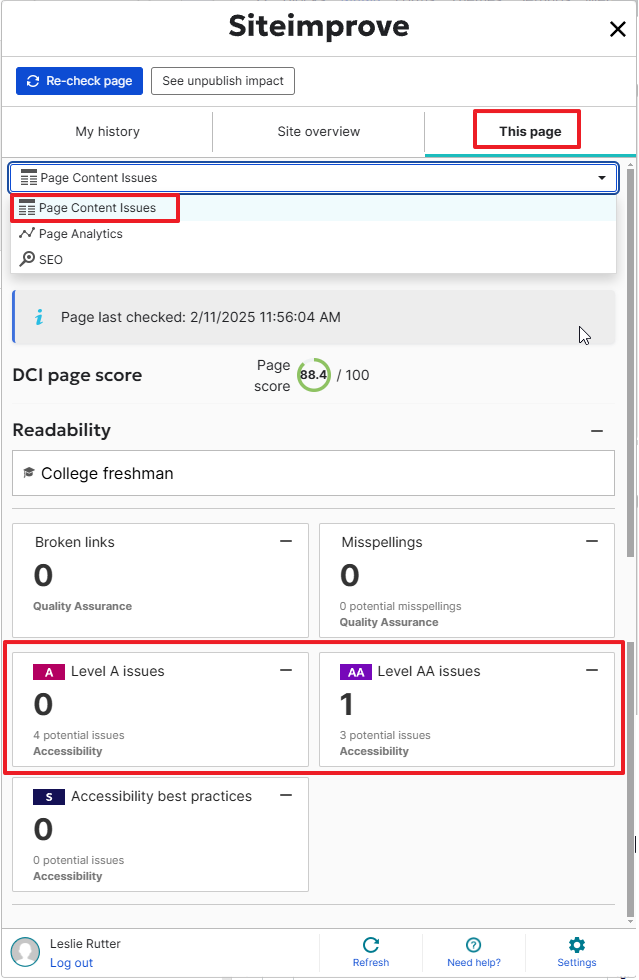
Siteimprove CMS plugin
 While editing a page, you can review the issues on that page and have Siteimprove recheck the page directly from the CMS.
See: blog post Siteimprove CMS plugin overview
Note: To review accessibility issues, make sure Page Content Issues is selected from the dropdown.
Clicking on the noted issues, A or AA, will open the page in Siteimprove to help you locate where on the page the issue resides.
Recheck the page to validate the issue no longer exists
From both Siteimrpove and the CMS plugin, you can recheck the page. This prompts Siteimprove to rescan the page.
- to top of page -
SEO Report
This report will give you an idea of how well your site is scoring in terms of search engine optimization, and what issues you could address to improve your SEO. The dashboard includes:
- SEO score details and progress gauge
- Top issues that could be fixed to improve score
- SEO score breakdown showing how each category is performing
- to top of page -
Quality Assurance Report
The Quality Assurance Report functions similarly to the accessibility and SEO report where that your site is given a score, however it is based on quality assurance criteria such as content quality, content freshness, security, and user experience. This dashboard has:
- Quality Assurance (QA) score details and progress gauge
- Readability test results
- Top QA issues and how much they can improve your score
- QA score breakdown showing how each category is performing
- to top of page -
Access Training
If you would like to get more training on Siteimprove and how to use it, Siteimprove provides a training platform called Siteimprove Frontier , where there are numerous courses that are available to take.
Here are some courses that we recommend:
- to top of page -
Requesting Scheduled Reports
If you would like to request scheduled reports of any dashboard to be sent out to you, you can submit a CMS Support request at the Help Desk Portal .
- to top of page -

